Information Design Project
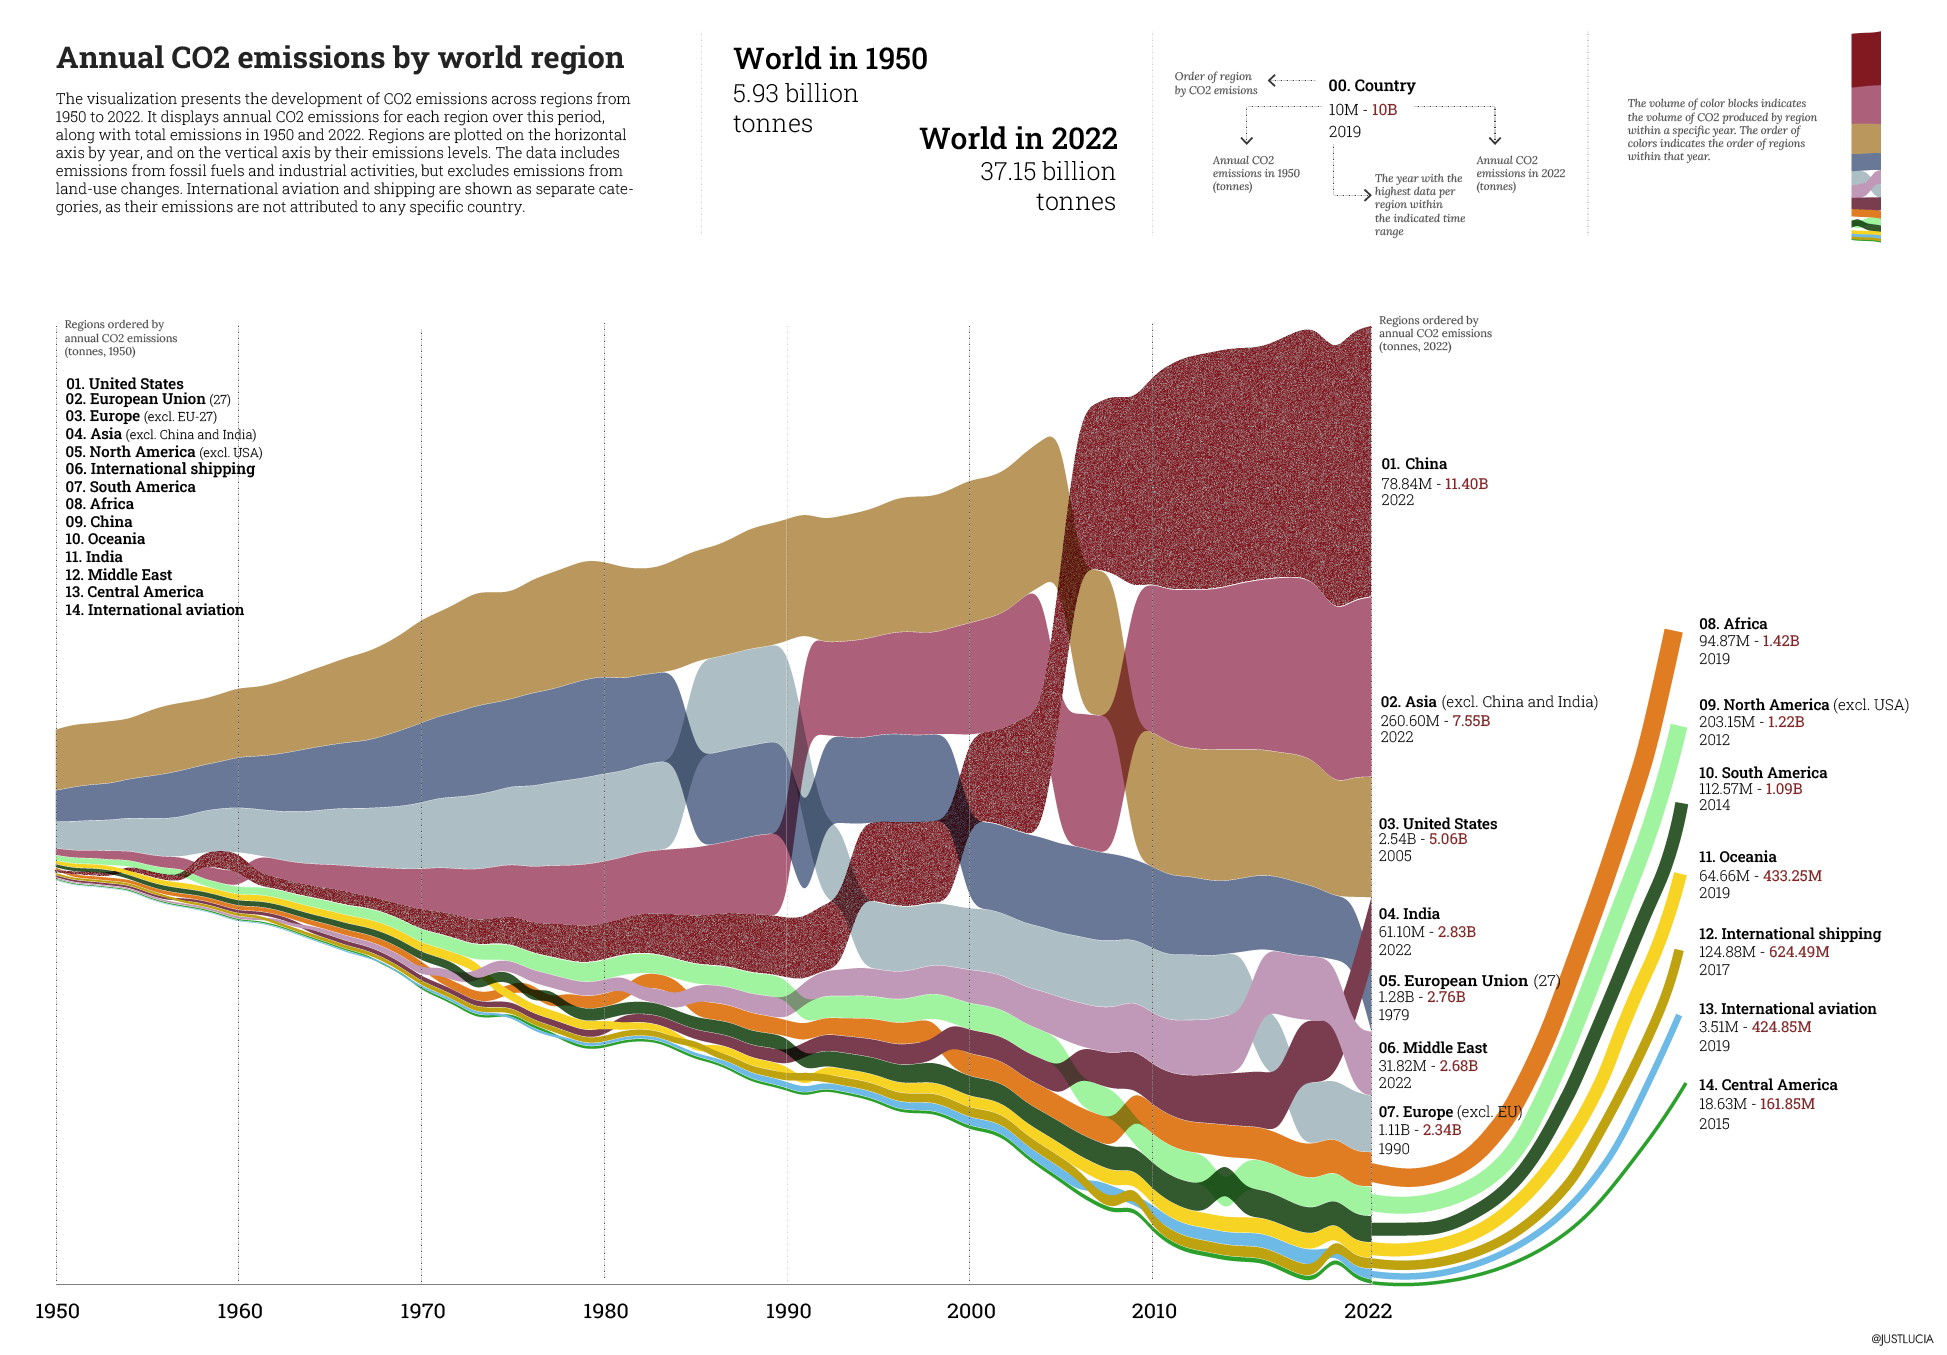
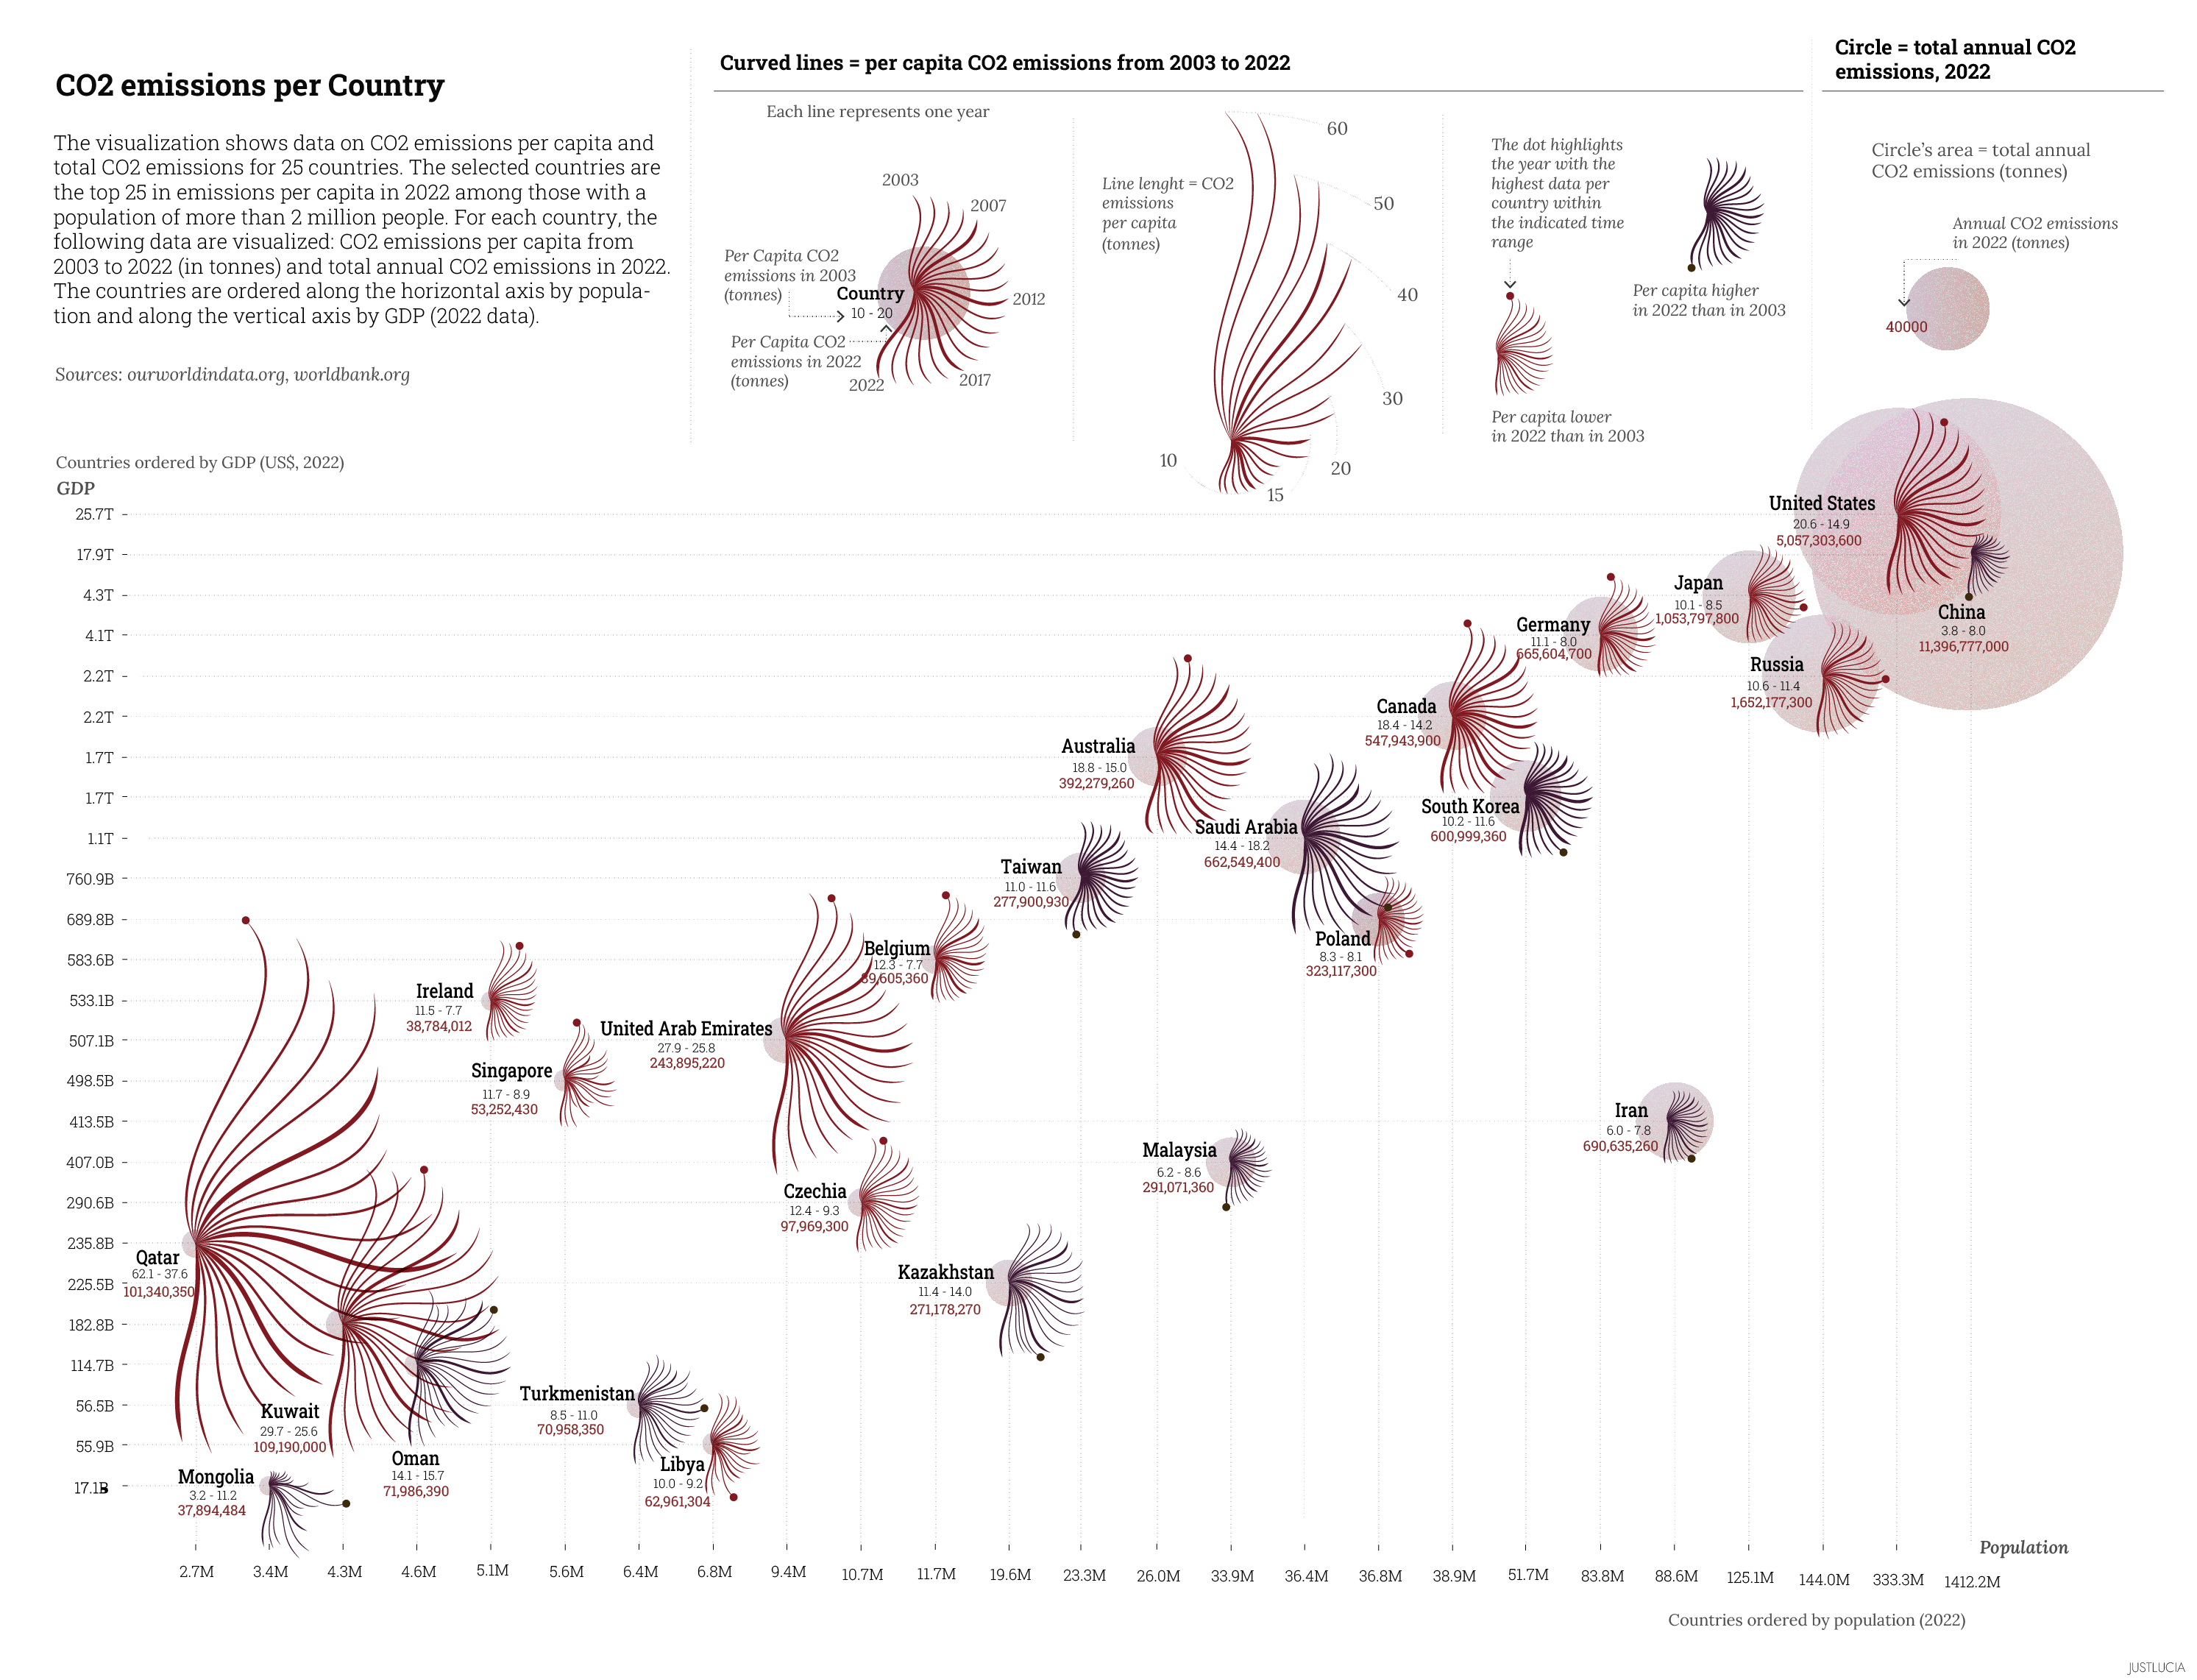
Explore CO2 emissions data per region and capita with our Information Design Project, turning complex data into engaging visual stories through arty infographics.

—
by
Information Design Project
Explore CO2 emissions data per region and capita with our Information Design Project, turning complex data into engaging visual stories through arty infographics.
Leave a Reply